Best of GMI · the ten canonical essays · 08 of 10
THE CULMINATION · 2023
The Everything Code.
The most profoundly important GMI I’ve written – the culmination of eighteen years of work. Once you see it all in one place, you can’t unsee it.
FROM THE GMI ARCHIVE · EXCERPT
EXCERPTED FROM THE GMI FEATURE ARTICLE:
MONTHLY PUBLICATION · APRIL 2023
(DEVELOPED ACROSS OCT 2022 – APR 2023)
DEEP THOUGHTS · GMI MONTHLY · APRIL 2023
The Everything Code
The whole enchilada – and no one else in the world has figured this out, as far as I am aware.
Over the eighteen years of writing GMI, I have authored some very important pieces. The key articles are all part of a larger narrative arc of my evolving framework. But now we are at the crux where it all comes together in one publication. This is probably the most profoundly important GMI I’ve written, and is the culmination of eighteen years of work. Once you see it all in one place, in one consistent and cohesive analysis, you can’t unsee it. It explains everything.
The Magic Formula
When I began GMI in January 2005, I led with my core thesis that the entire economic, financial and political world was being driven by three secular trends: debt, deflation and demographics. I have been using the Magic Formula of how to create GDP growth as the best way to understand how the world works, and why it is currently so fucked.
On average, 4.3m people will be retiring in the US each year for the rest of the decade. The demographic driver of GDP is dead. Forever. The aging population has also forced down productivity – we can’t change the demographics, but we can change productivity via technology. That is the essence of The Exponential Age. And the aging population plus lack of productivity has led to an increase in debt at all levels to compensate for the lack of growth.
The Clockwork Economy
In 2008, everything changed. If interest payments were too high for economic growth, then cut them to zero – and every major economy followed suit. The 100% most logical thing to do in 2009 was to refinance all debt in the system at zero rates. But the government never paid anything back. They just kept rolling the debt in one big refinancing cycle, where interest payments were financed by increasing the debt – essentially using their credit card to pay the interest on their credit card. So their debt compounded at an exponential rate.
This turned the US economy into a perfectly cyclical phenomenon based on the 3½-year refinancing cycle of those debts. All economic growth was used to pay the interest. Every 3½ years, like clockwork, the economy slows sharply as interest rates rise and bite hard into the debtors. Eventually QE arrives, along with rate cuts, the refi cycle begins again, and everyone rolls their debt. Low interest rates are a feature, not a bug. We cannot survive without them.
Why GDP and rates are tied at the hip
With private-sector debt at over 120% of GDP, ALL GDP growth – a trend rate of 1.75% – just pays the interest on the debt. If interest payments are 1.75% of GDP and GDP grows at 1.75%, then there is NO money left to fund fixed capital investment, which in turn lowers GDP. Interest rates simply must be equal to or below GDP growth for the system to sustain. If rates remain above GDP growth for any period, we force a debt deflation. This is exactly why the banks are now blowing up.
The Fed have exactly engineered rates below GDP since 2010, as have all central banks. It is purposeful. I continue to believe that yields are soon going to fall at a shocking pace. There is no way the economy can survive these rates – rates will hit near zero again in the coming 12 to 18 months, just in time to save everything.
The Magic Money Tree
All these issues are caused by the private sector being over 100% of GDP in debt. But there is another major issue: if the private sector eats 100% of GDP growth, then how does the US Government finance another 100% of GDP in debt? Answer: the Magic Money Tree, Quantitative Easing. Since 2009, Nominal GDP has grown $12tn, while US Government Debt has grown $21tn. Debt has grown in excess of GDP by $9tn.
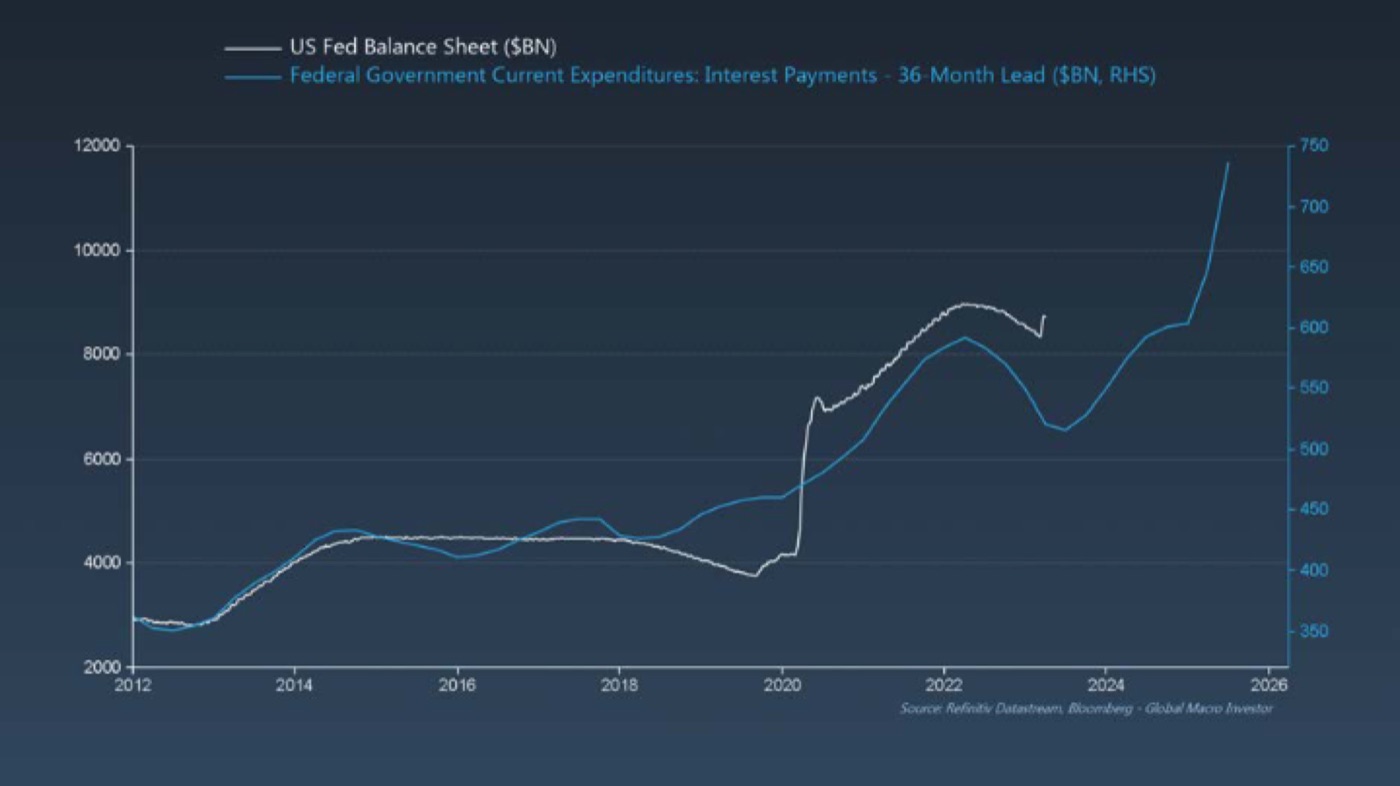
The stunning data I have found is that the ENTIRE balance sheet is basically explained by the interest payments 3½ years later. I have never seen this chart anywhere else, and it could not be any more important.
The Central Bank Accord
The Fed reportedly has 1000 PhD economists. It is my view that they know EXACTLY what they are doing – covertly monetising all interest-rate payments via new debt, which then goes onto the balance sheet. This is undoubtedly why Janet Yellen left the Fed and went to the Treasury. There is no independent Fed; the Government and the Fed are working together. And it is not only the Fed, but ALL central banks that are in accord. They must all monetise their governments’ interest payments, or the global system collapses. I can basically prove it – the Japanese and European numbers back out exactly the same.
The Poison Pill – Debasement
The narrative is that central banks inject liquidity that finds its way into asset prices – that it’s all a game of liquidity. But this analysis is wrong. Liquidity is a partial driver, but it’s not the KEY driver. The KEY driver of asset prices is the G5 central bank balance sheets combined. Everything they are doing in consort is driving asset prices, and provably so.
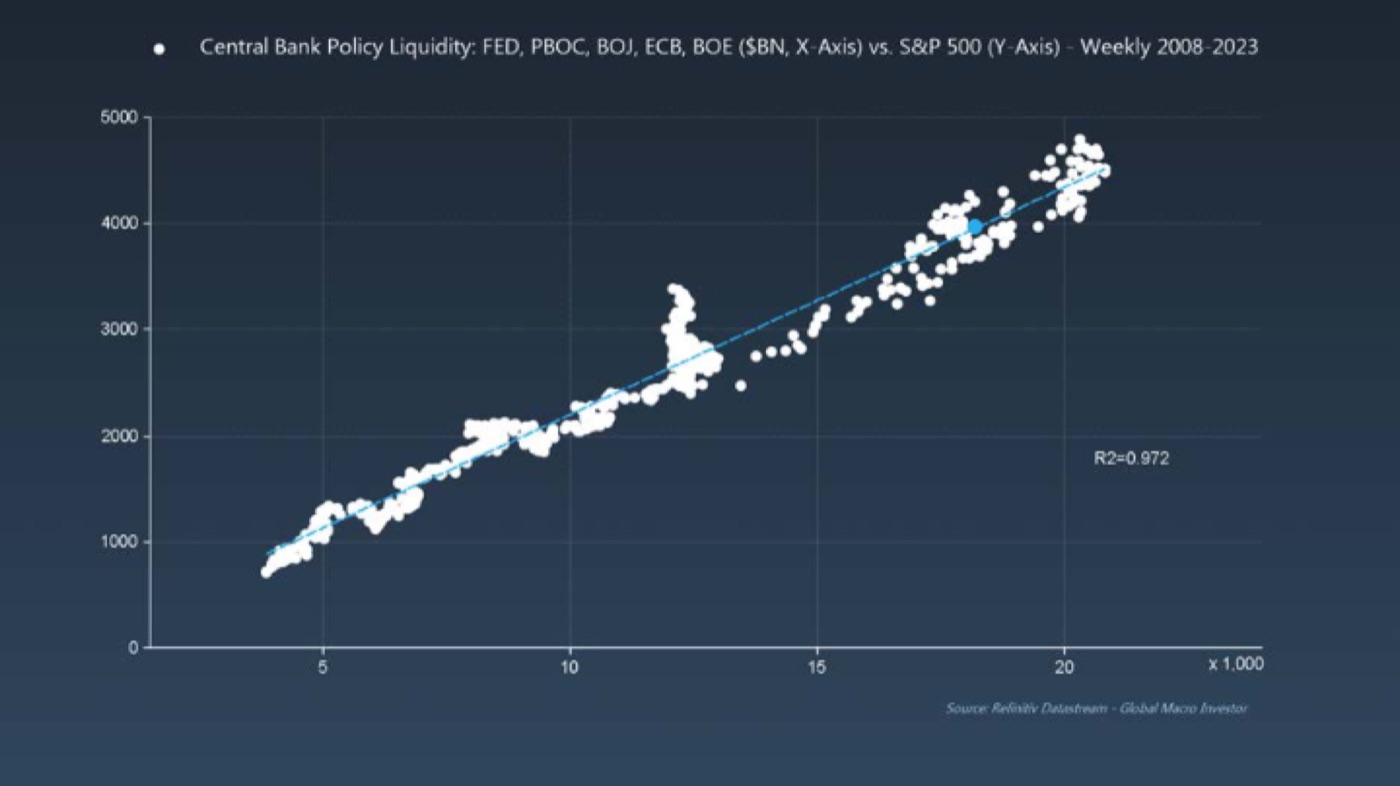
97% of the movements in the SPX can be explained by the G5 balance sheets. This is stunning. The magic trick the central banks discovered is that when they all monetise their interest payments and debt growth, the price of US assets rises – because the Fed, when it monetises, debases the world’s reserve currency and the key denominator of assets.
Debasement optically makes scarcer assets rise: US equities, gold, real estate and crypto. But earnings only rise in line with M2 growth, which rises less than the balance sheet – and that gives you the rise in the P/E ratio over time. P/Es are not valuations anymore but monetary indicators. You need to understand this, or you will lose money. This is why value investing doesn’t work.
The Death of the American Dream
Doesn’t it sound amazing that assets magically rise and make us all rich? But no – most people can’t afford assets, and the median American is getting poorer in asset-purchasing terms every year. The median American can buy 89% less of the S&P 500 than in 1980, and 26% less housing. This is why they are ANGRY. It is the Death of the American Dream. And in debasement terms, the only two assets that have created any real wealth are technology and crypto.
The Big Reveal
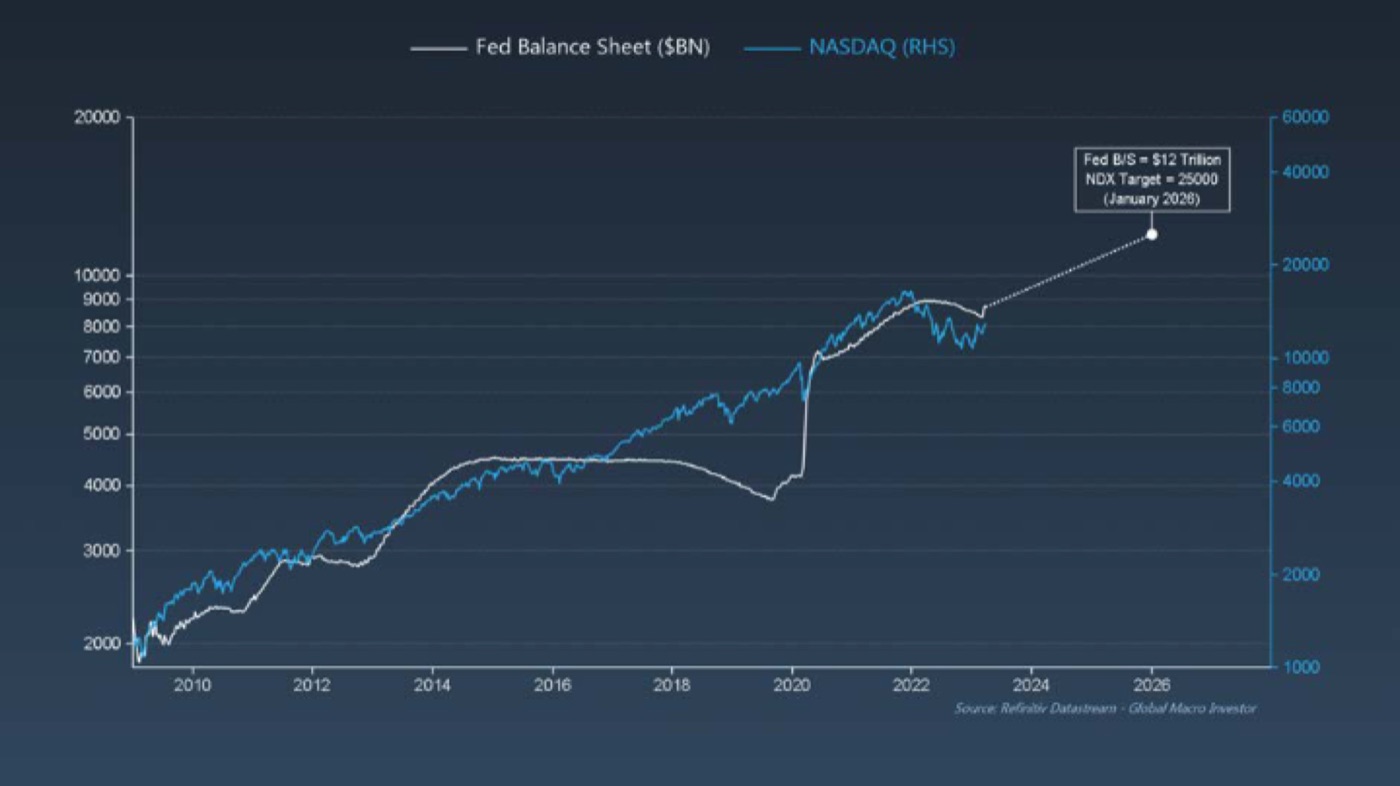
Now I’m going to bring it all together. We know government debt growth is almost entirely driven by interest payments; that these payments end up on the Fed’s balance sheet; that financial crises get added on top; and that all central banks are doing the same. That gets us to a Fed Balance Sheet of $12tn to $14tn by end of 2025. And I can prove out this expansion another way: global liquidity explains 97% of equity returns, and I can now forecast liquidity.
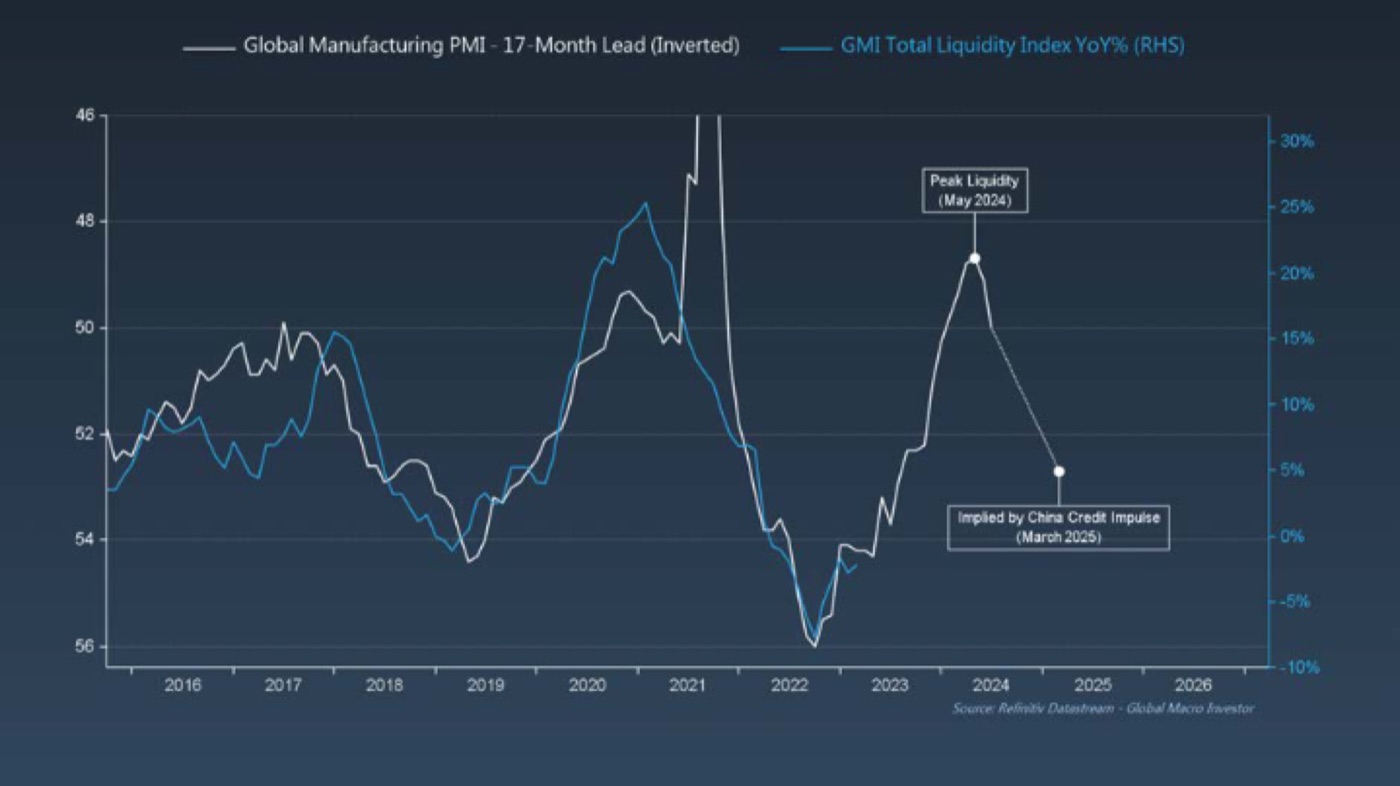
If we can forecast liquidity, which we can, then we can forecast the return on assets.
It is basically written in stone for this next cycle, due to the relationship between assets and liquidity, and in turn its relationship with the business cycle.
Global liquidity is a near-perfect fit for the NDX. The NASDAQ has a high probability of hitting 21,000 by May 2024 and rising to 23,000 or higher by March 2025 – and the Fed Balance Sheet projection gives 25,000 by the same date. It is all consistent. Liquidity projections suggest the NDX could rise 75% to 110% from here in the next 2½ years. I bet that wasn’t on your bingo card.
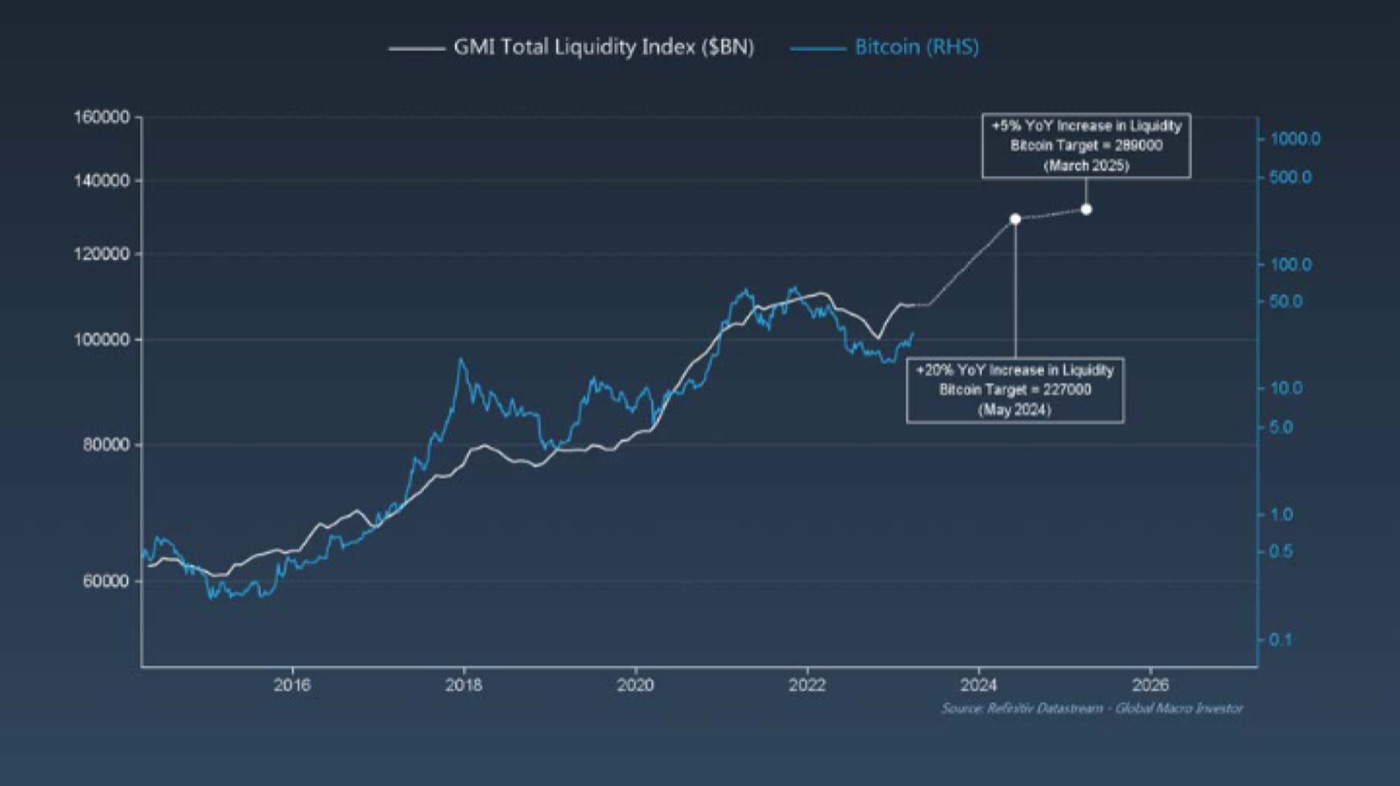
And Bitcoin is also highly correlated to GMI Global Liquidity, giving an approximate upside of around $290,000 – close to the market cap of gold – consistent with the top of its log channel. That implies a trough-to-peak of 15x, which would be the smallest move in bitcoin’s history. Since 2013, BTC did 68% per annum in excess of the Fed Balance Sheet; the NDX did 6%; the SPX did zero; gold did -4%; real estate -2.5%.
The Everything Code
The Everything Code is the ability to forecast future liquidity, and using the 97% correlation with assets, to forecast asset prices into the future.
Everything is driven by the debasement of fiat. It will not last forever, but it will last until the game truly changes, when the Renaissance is fully underway.
The Renaissance
In the end, what is in The Everything Code is the answer to all our problems – and these are not going to be solved by some Great Reset, but by a Renaissance. The Global Financial Crisis was THE Fourth Turning moment when everything changed. The future is a technology revolution that changes humanity forever. Witness the anger over crypto, the fear about AI, the denial around gene editing, self-driving cars, robots, the metaverse, new energy – all inevitable, all already happening, and all building network effects upon each other.
AI is the first ever example of Reed’s Law – Metcalfe’s Law squared. It is, without question, the biggest macro setup of all time, with the central banks giving us a massive tailwind in our technology investing, and on top forcing us to adopt digital assets to get out of the trap they have set. I think the advent of AI is as important a breakthrough for humanity as the splitting of the atom. Above all, The Exponential Age is a productivity miracle on a scale never seen before – the only way out of the trap of the Magic Formula.
The way out – Yield Curve Control
We have probably ten to fifteen years before this Renaissance really drives GDP again, and before that the central banks will first print a LOT. But we can’t keep adding compounded rising interest payments forever, or assets hit hyperinflation. The answer is already upon us, trialled by the Japanese: Yield Curve Control. As long as GDP remains well above interest rates, the Government’s debt problem is solved – and YCC can continue ad infinitum until GDP growth materialises from the productivity gains of the Exponential Age.
This is what the US did post-World War II: GDP grew at 5%, rates were capped at 2.5% via YCC, the Fed Balance Sheet as a percentage of GDP collapsed, and equities rose 750% in ten years. It took fifteen years to sort out the mess from the war. It’ll probably take fifteen years to sort out this mess. But with negative real rates, you want to own all the risk assets you can. This will be the Exponential Age of technology. Strap in. It’s going to get wild.
The Everything Code has ALL the answers. Everything else is blah, blah, blah. The code has been cracked. It is my gift to you all – the result of eighteen years or more of hard work.
Membership
Read GMI for yourself.
Twenty-one years of calls like this one, and the positioning each month. Explore the research, the platform and the membership options.
Explore membershipRequest preview access